Twitter is a platform of over 340 million users, producing over 500 million tweets each day. Even just an insight into 1% of those tweets has the potential to provide a decent understanding into what’s happening in the world. If something is in the public domain, it’s on Twitter.
This post explores a technique to digest tweets down into a data structure that allows for user interaction, breaking story identification or even brand sentiment analysis.
The process begins by processing data from Twitter – for-which there are a number of approaches.
Data Processing
Data can be processed in many ways – two common to analytical processing are Batch & Stream Processing. At a high-level, the distinction is that with Batch Processing, the dataset for processing exists before processing begins. With Stream Processing, the dataset is not known ahead of time but instead arrives ‘bit-by-bit’.
Batch Processing
Batch Processing is the most common technique deployed for analytical workloads – perhaps each evening you want to take the days sales from your store and identify trending products, or perhaps you want to analyse the output of a collection of sensors following a rocket test to understand mechanical stresses that are felt across the vehicle. Batch Processing takes a defined amount of data as input at a specific time (t) and performs a series of actions upon it to create an output after-which processing ends.

However, sometimes we don’t want to wait for the entirety of the dataset to be available before we start processing it. Perhaps it’s not possible to have the entire dataset available prior to processing as the data does not yet exist. Regardless, the questions we ask of our batch datasets we could also ask to a more realtime flow of data – this is achieved through Stream Processing.
Stream Processing
Whilst not necessarily a new approach to data processing, Stream Processing is the processing of data whereby the dataset is not a known quantity. There could be 5 pieces of data to analyse or 5,000,000; 3 pieces of data could arrive each second most of the time, and at other times 5,000 pieces of data could arrive each second. Stream Processing allows us to process data as and when it arrives in a realtime manner.
In the rocket example, we analyse the sensor data as values are produced, not once the test has finished and all sensor outputs collated. This allows us to make decisions during the test as opposed to afterwards which could be useful if we’re looking to avoid an unplanned disassembly!
With Batch Processing, as the dataset is known ahead of time, the input can be split and assigned to compute resources ahead of execution – an execution plan can be created (if interested, read into MapReduce). With Stream Processing, we’re a lot more reactive and as such these architectures can often seem more complicated. However, as you should see in this post, that isn’t always the case and shouldn’t put you off.
Given we want to process tweets in realtime, it seems we need to implement a form of Stream Processing to meet our requirements.
Twitter Streaming
It turns out Twitter have an API to stream a 1% sample of tweets – the question then is given this information, how do we make sense of it?
Extracting Knowledge
I wanted to focus on two core elements when processing tweets – relevance meaning exposing words that ‘mean something’, and confidence meaning how relevant words come together to confidently outline a story.
I’m no linguistic expert, but let’s work through an example:
Fantastic goal from Mane this evening
From this tweet, the words ‘fantastic’, ‘goal’, ‘mane’ and ‘evening’ are relevant to understanding what’s happening. The words ‘from’ and ‘this’ whilst meaningful, are arguabley not as useful for my use case, they’re typically known as stop words. Furthermore, these extremely common words will be found in many tweets not relating to a goal scored by Mane, so it’s probably best we discount them in our analytics to avoid noise.
Secondly, confidence. If one person tweets that Mane has scored are goal, are we confident that he has? Probably not. If 50 people tweet Mane has scored a goal, I’d argue it’s likely that he has. This is the approach I have taken. There are obviously other techniques such as trusting some Twitter accounts more than others – much like how backlinks work within search engine indexing algorithms.
Correctness is also worth a mention, particularly in todays world. It’s not something I’ve tried to guard against in this piece of work as my primary goal is not to present correct information, just information that’s ‘trending’ on Twitter (at a level of detail that does not rely on hashtags).
Once we’ve received data from Twitter, we’re going to need a data structure to support our use case so we can programmatically record relevance and confidence.
Synaptic Graph
Again, that common data structure, the Graph, provides the mechanism to store the analysis. A visual example can be seen below.
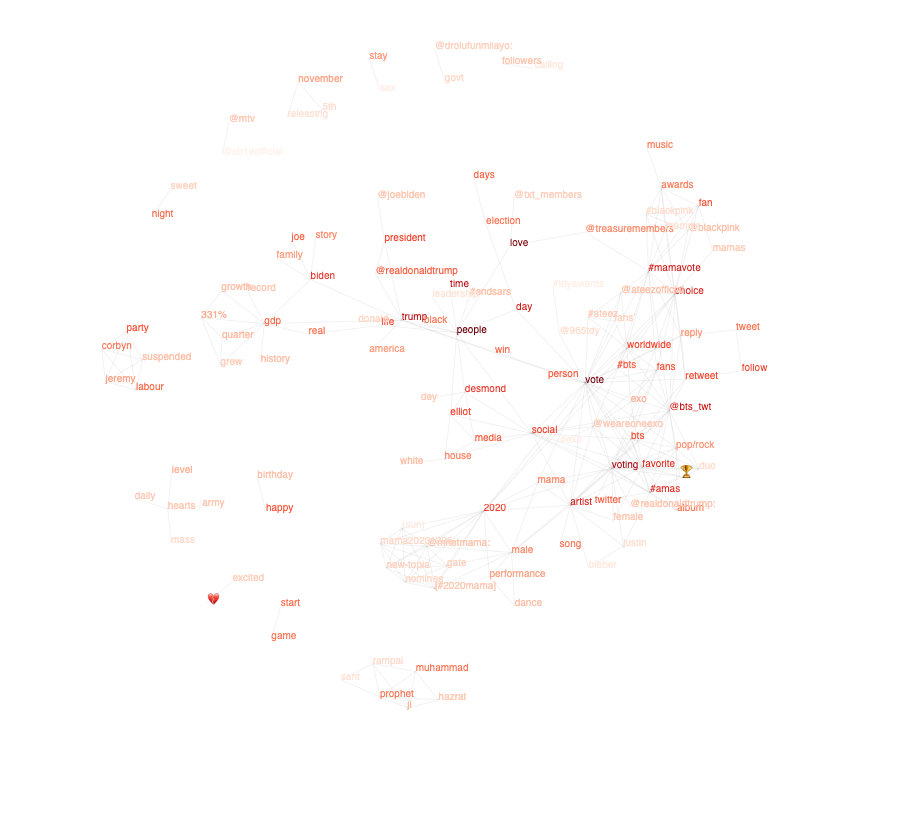
The boldness of the words depicts how often the word is mentioned in tweets and the lines indicate an association between words that meets the given confidence criteria.
You will be able to see some stories in the above graph, but let’s look at some examples in further detail.
Examples
Unfortunately, the week of testing was not a particularly great one for the world and so I apologise for using such sensitive events in my analysis.
Nice, France Attack
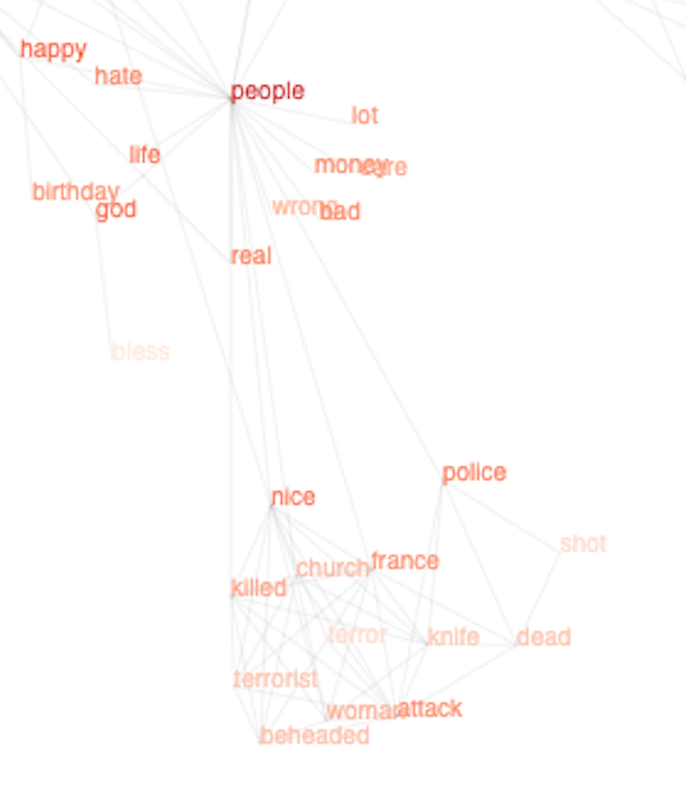
The recent events in Nice, France appeared in the analysis. Initially ‘nice’ and ‘attack’ became apparent on the graph, swiftly followed by more details of what was happening on the ground as people began to tweet.
You can see from the boldness of the text that we’re pretty confident there’s been an attack in Nice, France and that the Police are involved. Details are emerging that it could be terrorist related and that the police are associated with a shot. However this exemplifies an issue with this data structure – it appears the police have shot someone dead.
It may be that early tweets were suggesting that the police had shot someone dead and the correctness issues outlined earlier becomes apparent. Or perhaps the tweets just contain information about the police attending an incident where people had died and the police had fired shots. The graph records useful, relevant information, but it isn’t a source of truth.
US Election
As you would expect, the US election is accounting for a large quantity of tweets at present.

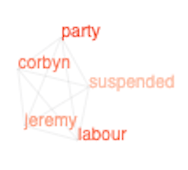
Labour Party
The recent EHRC report into the Labour Party reported that Jeremy Corbyn was suspended from the party.
Depending on the tweets provided within the 1% sample stream, you can end up with separate graphs which whilst related in the real world, have not yet been connected through analysis. This can be seen opposite. As processing continued, a connection was formed between these two graphs.

Conclusion
I mentioned at the start that Stream Processing doesn’t have to be complicated – this proof of concept used client side Javascript and Google Chrome to open up a persistent HTTP connection, processing 70 tweets per second. If you’re trying to solve a data analytics problem, don’t feel it’s out of reach and you need to stand up an Hadoop cluster. Start small and you’ll be surprised at how much you can prove and achieve.
For me, this project will continue and I’ll report back on future versions. My efforts will focus on weeding the graph of old news over time, refining the deletion of stop words and perhaps overhauling the UI altogether. If you have any ideas, please let me know.
